
Z6_TQQI9B1A0OVQC0QCILUKQD1464

Z7_TQQI9B1A0OVQC0QCILUKQD14U2
Web Content Viewer
Actions
Portfolio Overview
Portfolio Overview

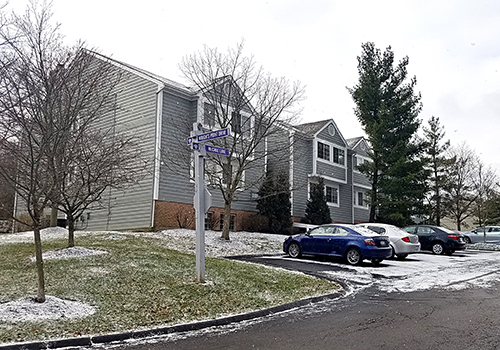
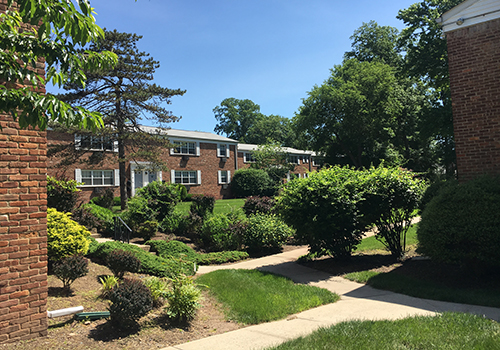
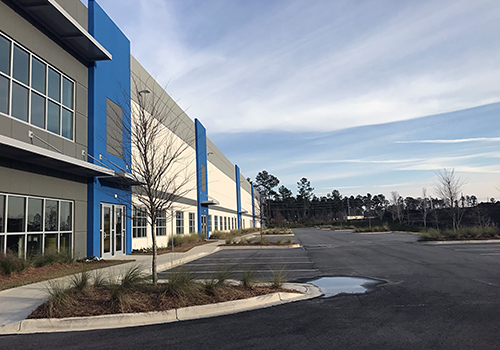
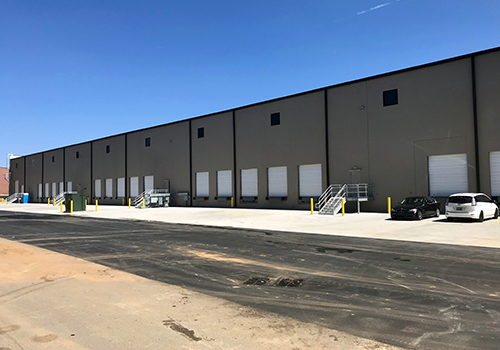
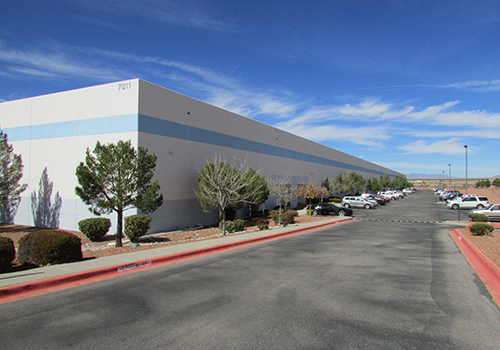
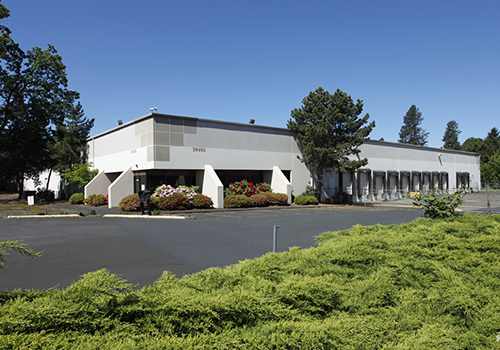
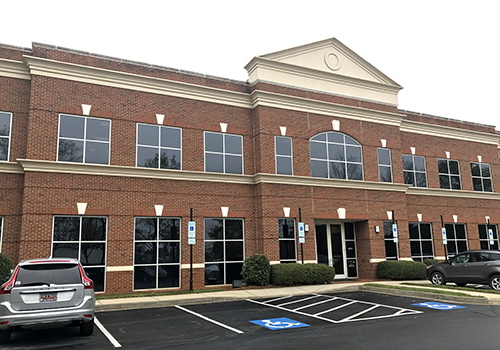
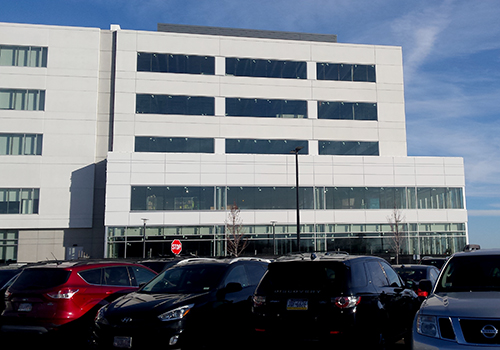
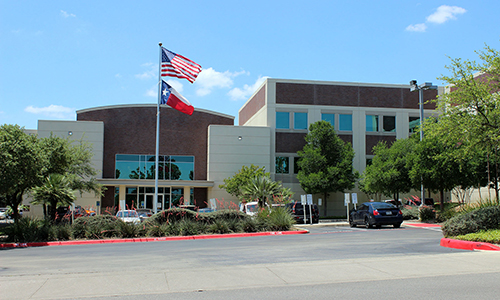
Recent Portfolio Activity
View a listing of our recently completed commercial mortgages. Let us know what we can do to finance your next commercial real estate investment.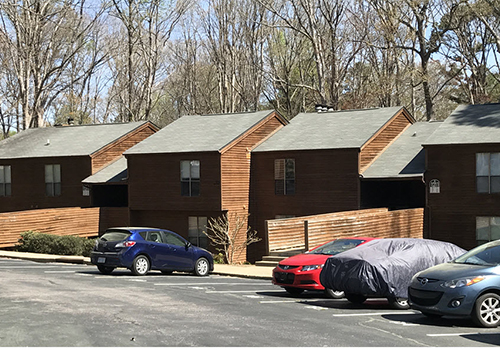

This informational release is not intended for general publication or distribution and does not constitute an offer by OneAmerica or any of its affiliates to make a loan or enter into any other transaction. This informational release is not and shall not be deemed to be a representation or warranty of any kind by OneAmerica or any of its affiliates and shall not be relied upon by any person or entity for any reason.
Distribution of Mortgage Loans by Property Type
| Property Type | Loan Count |
Outstanding Principal Balance |
% of Portfolio |
|---|---|---|---|
| APARTMENT | 165 | 1,013,791,862.32 | 20.8% |
| HOTEL MOTEL | 2 | 16,016,782.77 | 0.3% |
| INDUSTRIAL | 217 | 1,180,125,670.25 | 27.4% |
| MISCELLANEOUS | 25 | 46,960,848.13 | 3.2% |
| MIXED | 1 | 2,847,744.81 | 0.1% |
| OFFICE | 102 | 505,587,770.41 | 12.9% |
| RETAIL | 281 | 1,311,028,913.71 | 35.4% |
| TOTAL | 793 | 4,076,359,592.40 |
Regional Distribution of Mortgage Loans
as of December 31, 2023

Mortgage Loan Delinquencies
| December 31 | OneAmerica | Industry Average* |
|---|---|---|
| 2002 | 0.0% | 0.4% |
| 2003 | 0.0% | 0.1% |
| 2004 | 0.0% | 0.1% |
| 2005 | 0.0% | 0.1% |
| 2006 | 0.0% | 0.1% |
| 2007 | 0.0% | 0.0% |
| 2008 | 0.0% | 0.1% |
| 2009 | 0.0% | 0.2% |
| 2010 | 0.0% | 0.2% |
| 2011 | 0.2% | 0.1% |
| 2012 | 0.0% | 0.1% |
| 2013 | 0.0% | 0.1% |
| 2014 | 0.0% | 0.1% |
| 2015 | 0.0% | 0.0% |
| 2016 | 0.0% | 0.0% |
| 2017 | 0.0% | 0.0% |
| 2018 | 0.0% | 0.05% |
| 2019 | 0.0% | 0.04% |
| 2020 | 0.0% | 0.16% |
| 2021 | 0.0% | 0.04% |
| 2022 | 0.0% | 0.11% |
| 2023 | 0.0% | 0.32% |
| * - Source: ACLI | ||